What do visitors do when they land on your website? Want to know how to gather that information and use it to make improvements to your website design?
Understanding what your visitors look at, hover over, and click on can tell you a lot about their wants and needs. And once you know that information you can use it to identify areas in which you can improve your site.
The guys at Hotjar can help you do just that, with the main features of their platform featured in the infographic below.
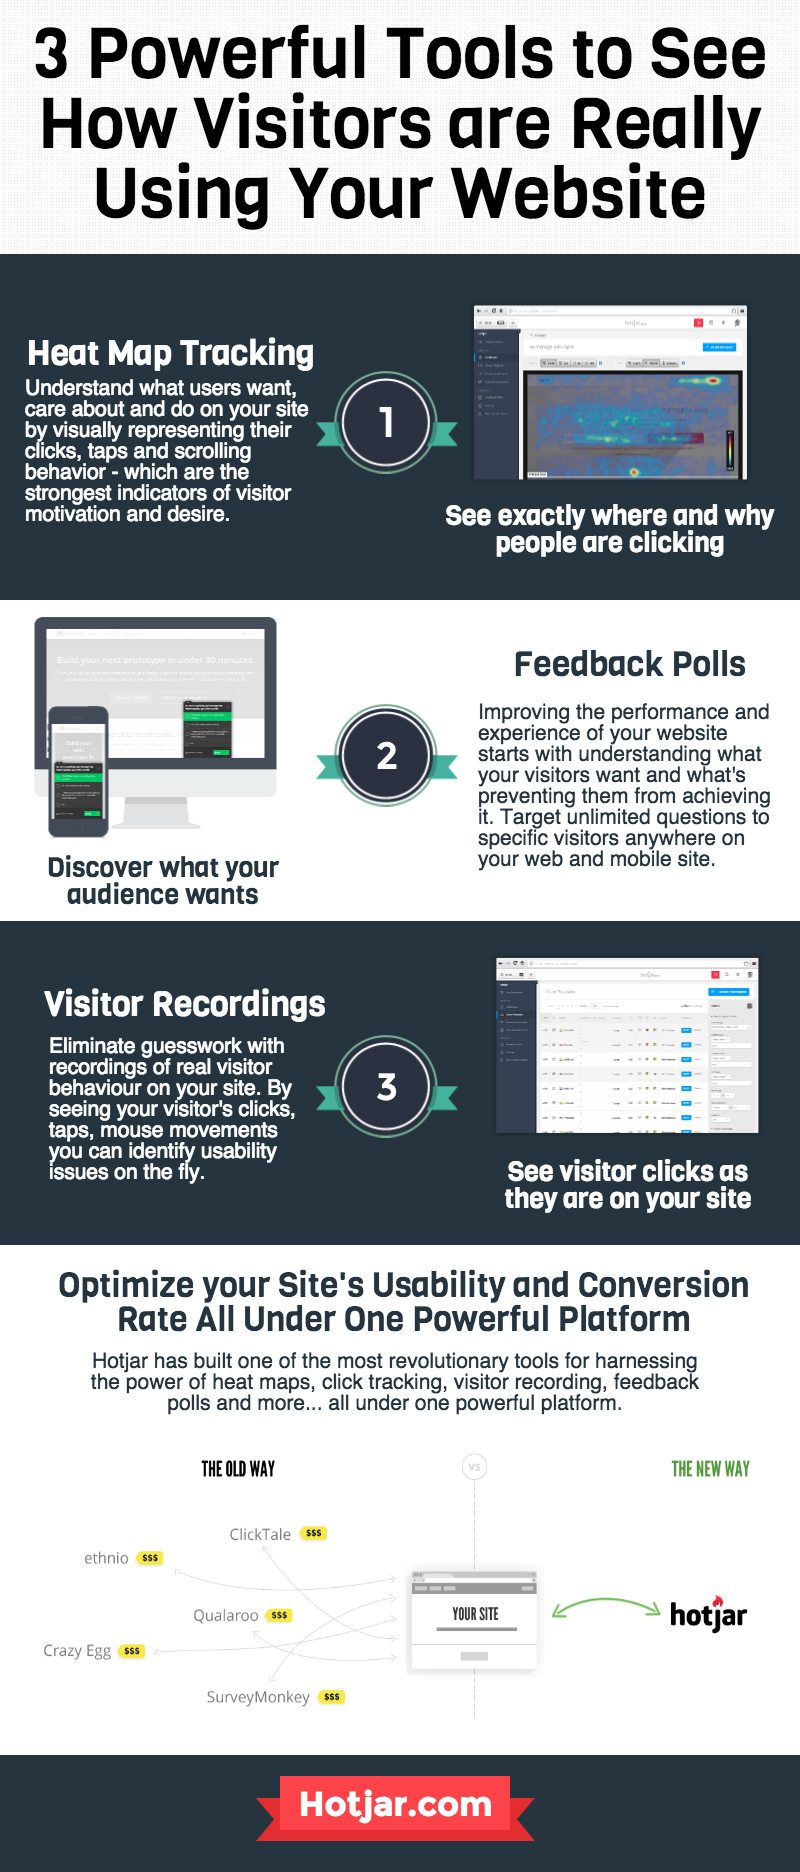
In today’s digital age, having a website is essential for businesses and individuals alike. Whether you’re running an e-commerce store, a personal blog, or a corporate website, understanding how visitors interact with your site is crucial for success. This is where web analytics tools come into play.
Web analytics tools provide valuable insights into how visitors are using your website. They can help you track user behavior, analyze traffic patterns, and make data-driven decisions to improve your site’s performance. In this blog post, we will explore three powerful web analytics tools that can help you gain a deeper understanding of how visitors are using your website.
1. Google Analytics
Google Analytics is perhaps the most well-known and widely used web analytics tool. It offers a comprehensive set of features to track and analyze website traffic and user behavior. Whether you have a small personal blog or a large e-commerce website, Google Analytics can provide you with valuable insights into your site’s performance.
Key Features of Google Analytics:
a. Traffic Sources
Google Analytics allows you to see where your website traffic is coming from. You can view the sources of traffic, such as organic search, direct traffic, referrals, and social media. This information helps you understand which marketing channels are driving the most visitors to your site.
b. Audience Demographics
You can also access demographic data about your website visitors, including their age, gender, location, and interests. This information is valuable for tailoring your content and marketing efforts to better target your audience.
c. Behavior Flow
The Behavior Flow feature in Google Analytics provides a visual representation of how visitors navigate through your website. You can see the most common paths users take and identify potential bottlenecks or areas where visitors drop off.
d. Conversion Tracking
Google Analytics allows you to set up goals and track conversions. Whether your goal is to drive sales, generate leads, or increase newsletter sign-ups, you can monitor how well your website is performing in terms of achieving these objectives.
e. Real-Time Data
With the real-time data feature, you can see how many visitors are currently on your website, which pages they are viewing, and where they are located. This can be useful for monitoring the immediate impact of marketing campaigns or website changes.
Google Analytics is a free tool, making it accessible to businesses and website owners of all sizes. To get started, you need to install a tracking code on your website, which is provided by Google Analytics when you create an account. The data collected is typically delayed by a few hours, but it provides a wealth of information that can help you optimize your website’s performance.
2. Hotjar
Hotjar is a user behavior analytics tool that provides insights into how visitors interact with your website through heatmaps, session recordings, and surveys. It’s a valuable tool for gaining a deeper understanding of user behavior and improving the user experience.
Key Features of Hotjar:
a. Heatmaps
Hotjar offers various types of heatmaps, including click heatmaps, move heatmaps, and scroll heatmaps. These heatmaps visually represent where users click, move their mouse, and scroll on your web pages. Heatmaps make it easy to identify which parts of your website are getting the most attention and which areas may be overlooked.
b. Session Recordings
Session recordings allow you to watch video recordings of individual user sessions on your website. This feature provides valuable insights into how users navigate your site, where they encounter difficulties, and where they drop off. It’s like having a virtual user testing panel at your disposal.
c. Surveys and Feedback
Hotjar enables you to create on-site surveys and collect feedback from your visitors. You can ask targeted questions or use Net Promoter Score (NPS) surveys to gauge user satisfaction. This qualitative data can help you understand the “why” behind user behavior.
d. Funnel Analysis
With funnel analysis, you can track the steps users take to complete specific actions on your website, such as making a purchase or signing up for a newsletter. Funnel analysis helps you identify where users are dropping out of the conversion process and pinpoint areas that need improvement.
Hotjar offers both free and paid plans, making it accessible to businesses of all sizes. The free plan includes basic features like heatmaps and surveys, while the paid plans offer more advanced capabilities and additional user insights. Integrating Hotjar with your website is relatively straightforward, requiring you to add a small code snippet to your site’s pages.
3. Crazy Egg
Crazy Egg is another powerful web analytics tool that specializes in visualizing user behavior through heatmaps, scrollmaps, and overlays. It’s designed to help you make data-driven decisions by understanding how visitors engage with your website.
Key Features of Crazy Egg:
a. Heatmaps
Crazy Egg’s heatmaps provide insights into user interactions, such as where they click, move their mouse, and scroll. The tool offers different heatmap types, including click heatmaps, move heatmaps, and attention heatmaps, allowing you to analyze user engagement at a granular level.
b. Scrollmaps
Scrollmaps visualize how far down the page visitors scroll before leaving. This can help you optimize your content layout and determine if important information is being overlooked by users.
c. Overlay Reports
Overlay reports display the number of clicks on specific elements of your web pages, such as buttons, links, or images. This information helps you identify which elements are most engaging and which may need improvement.
d. A/B Testing
Crazy Egg offers A/B testing capabilities, allowing you to create and test different variations of your web pages to see which performs better in terms of user engagement and conversions.
e. Recordings
Crazy Egg also offers session recording features, allowing you to watch video recordings of user sessions to gain insights into how they navigate your website.
Crazy Egg offers a 30-day free trial, and pricing varies based on the number of pageviews you want to track. Like Hotjar, integrating Crazy Egg into your website is relatively simple and requires adding a code snippet to your site’s pages.
Conclusion
Understanding how visitors are using your website is essential for improving user experience, optimizing conversion rates, and achieving your online goals. The three powerful web analytics tools discussed in this blog post—Google Analytics, Hotjar, and Crazy Egg—offer a range of features to help you gain insights into user behavior and make data-driven decisions.
While Google Analytics provides comprehensive data on website traffic and user demographics, tools like Hotjar and Crazy Egg take user behavior analysis to the next level with heatmaps, session recordings, and surveys. By leveraging these tools, you can gain a deeper understanding of your audience and make the necessary adjustments to enhance your website’s performance and user satisfaction.
Remember that the choice of web analytics tool depends on your specific needs, budget, and the depth of insights you require. Whether you opt for the free and widely-used Google Analytics or invest in more specialized tools like Hotjar and Crazy Egg, the key is to use the data collected to continuously improve your website and provide a better experience for your visitors.

Author:
Mark Ford

The Essential Marketing Toolkit: 19 Tools Every Modern Marketer Should Know About
Are you looking for the most effective tools to streamline your marketing, boost creativity, and save time? Want to discover the must-have platforms that every modern marketer should be using to stay ahead of the competition? […]