Are you considering using infographics as part of your SEO strategy? Need some help deciding what to actually put in them?
A well designed infographic can earn you hundreds of juicy backlinks – and those links are what will fire your landing pages up the Google rankings. You can’t just include any old rubbish though, you need to make sure the content is relevant, helpful and structured in as easy to follow way.
For some guidance take a look at these 7 types of infographics from Ethinos.
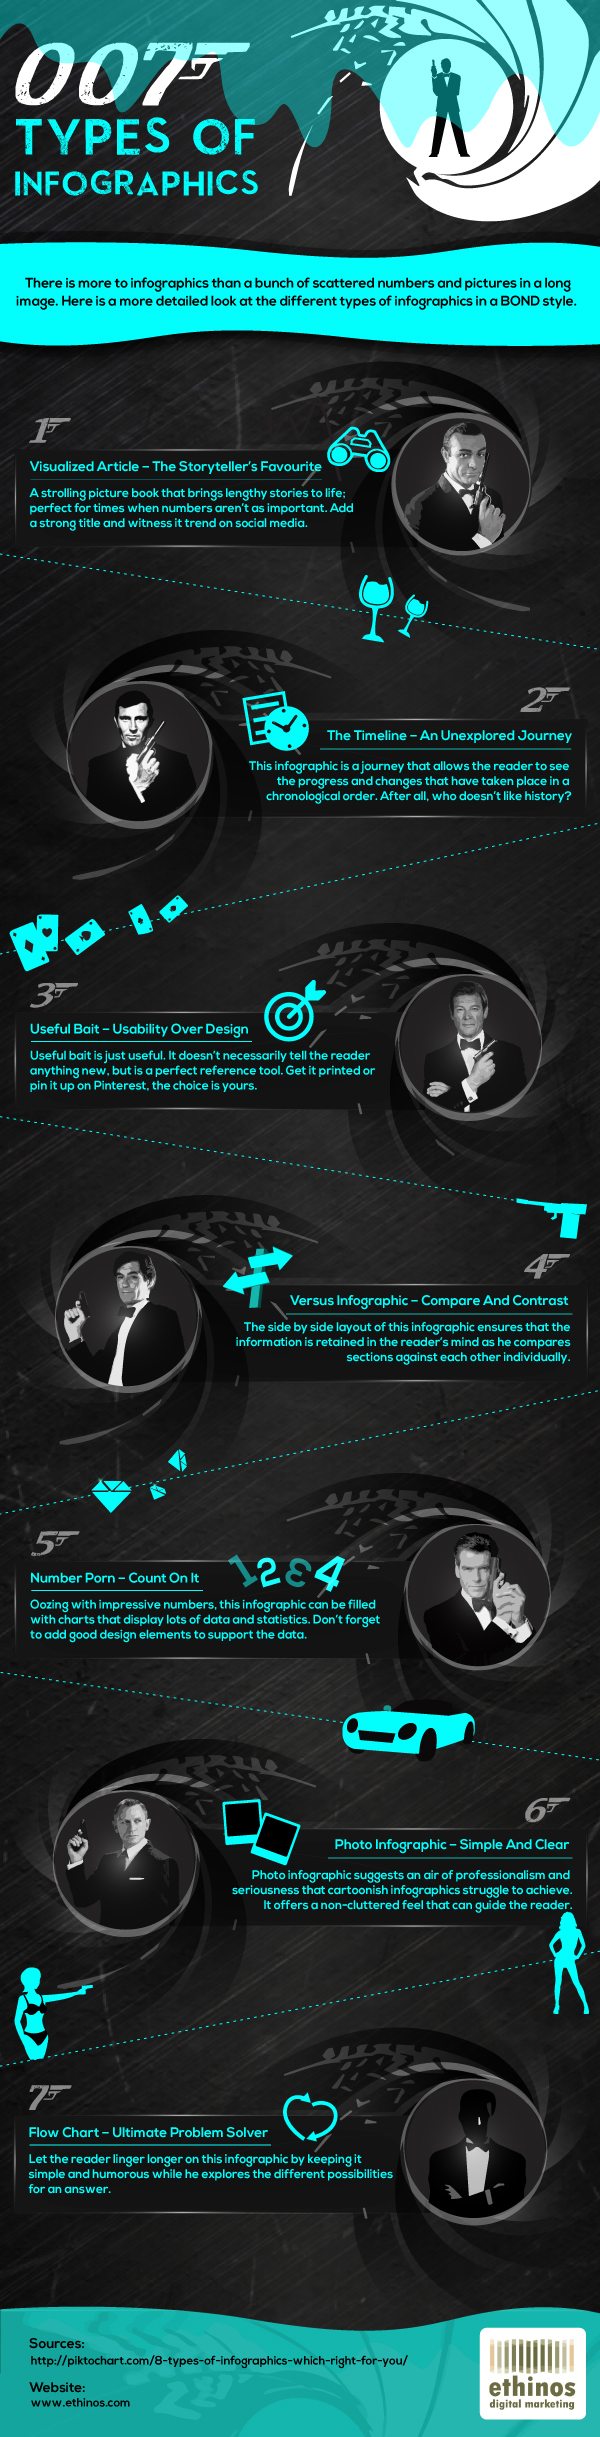
In the fast-paced world of digital marketing, staying ahead of the competition is crucial. To succeed, you need to adopt strategies that grab your audience’s attention and deliver your message effectively. One powerful tool in your marketing arsenal is the infographic. Infographics are visual representations of information that can simplify complex data, making it more digestible for your audience. In this blog post, we’ll explore seven types of infographics that will help you do marketing in a style reminiscent of the suave and sophisticated James Bond, aka 007. These infographics are not just visually appealing but also effective in conveying your message.
1. The Spy Mission Infographic
Imagine your marketing campaign as a covert spy mission, and your audience as secret agents waiting for instructions. The Spy Mission Infographic is the perfect tool to engage your audience and guide them through the mission. This type of infographic typically includes:
- A Briefing Section: Introduce your audience to the mission’s objectives and key details. Use visuals like magnifying glasses, spy gadgets, and a top-secret folder to create an immersive experience.
- Data Charts: Provide data on your product, service, or industry in an easily digestible format. Use bar graphs, pie charts, and line graphs to highlight key statistics.
- Action Steps: Lay out a step-by-step plan for your audience to follow. Use icons resembling footprints, arrows, or checkpoints to make it visually appealing and easy to follow.
The Spy Mission Infographic combines storytelling with data presentation, making it a compelling choice for marketing campaigns where you want your audience to feel like they’re part of an exciting adventure.
2. The Casino Royale Stats Infographic
In the world of James Bond, casinos are synonymous with glamour and intrigue. The Casino Royale Stats Infographic allows you to present your marketing data in a way that’s both elegant and persuasive. Here’s what it typically includes:
- Casino Theme: Design your infographic with elements reminiscent of a high-end casino. Think playing cards, roulette wheels, and neon lights. The goal is to make your data presentation feel luxurious.
- Key Metrics: Highlight your most important marketing metrics. This could include conversion rates, ROI, or customer satisfaction scores. Use bold typography and contrasting colors to draw attention to these figures.
- Success Stories: Share success stories or case studies in a visually appealing format. Use graphics of champagne glasses to celebrate achievements and make your brand shine.
The Casino Royale Stats Infographic adds a touch of elegance and sophistication to your marketing materials, helping you make a lasting impression on your audience.
3. The Secret Agent Roadmap
Every secret agent needs a roadmap to navigate through their missions, and your audience needs one to navigate your marketing strategy. The Secret Agent Roadmap infographic is an excellent way to guide your audience through a series of steps or processes. Here’s what it should include:
- Starting Point: Begin with a clear starting point, represented by a “You Are Here” icon. This helps your audience understand where they are in the journey.
- Checkpoint Markers: Create checkpoints or milestones along the roadmap. Each marker should represent a significant stage or action. Use visuals like binoculars, briefcases, or spy hats to make them stand out.
- Paths and Routes: Connect the markers with paths or routes that show the progression from one stage to the next. Use arrows or dotted lines to indicate the direction.
- Call to Action: Include a compelling call to action at the end of the roadmap. This could be an invitation to contact you, sign up for a newsletter, or make a purchase.
The Secret Agent Roadmap infographic helps your audience visualize their journey, making it easier for them to understand and follow your marketing strategy.
4. The Villain vs. Hero Comparison
James Bond movies often feature a charismatic villain pitted against our heroic spy. In marketing, you can leverage this narrative structure to create a compelling Villain vs. Hero Comparison infographic. Here’s how it works:
- Characters: Identify the key players in your industry or niche. Your brand can be the hero, while a common problem or challenge can be the villain. Use iconic images or illustrations to represent each character.
- Attributes: List the attributes of both the hero and the villain. What makes your brand the hero? What negative qualities does the villain possess? Use visual cues like halos for the hero and pitchforks for the villain to emphasize the contrast.
- Solutions: Offer solutions or benefits that your hero (brand) brings to the table. Highlight how your brand can overcome the challenges posed by the villain.
The Villain vs. Hero Comparison infographic is a powerful storytelling tool that helps your audience see your brand as the solution to their problems.
5. The Gadget Showcase
James Bond is known for his impressive array of high-tech gadgets. Similarly, your products or services may have unique features or capabilities that set them apart. The Gadget Showcase infographic allows you to display these features in a visually appealing way:
- Gadget Icons: Create icons or illustrations representing your products or services. Make them look sleek and futuristic to capture the essence of Bond’s gadgets.
- Features and Benefits: Highlight the key features and benefits of your offerings. Use concise, compelling text and graphics to convey the advantages.
- User Scenarios: Illustrate how your products or services can be used in real-life scenarios. Show how they solve specific problems or enhance the user experience.
The Gadget Showcase infographic not only showcases your offerings but also positions them as must-have tools for your audience.
6. The Spy Agency Org Chart
In the world of espionage, spy agencies have complex organizational structures. You can use the Spy Agency Org Chart infographic to showcase your team’s expertise and capabilities. Here’s what it should include:
- Agency Name: Start with your brand’s name at the top, as if it’s the head of the agency.
- Team Members: List key team members and their roles. Use images or avatars for a personal touch.
- Skills and Specializations: Highlight the skills and specializations of each team member. This could include areas of expertise, certifications, or achievements.
- Mission Highlights: Showcase past successful missions or projects your team has undertaken. Use icons or visuals to represent these achievements.
The Spy Agency Org Chart infographic establishes your brand as a formidable force in your industry, backed by a team of skilled professionals.
7. The Spy Gadgets and Tools
No James Bond adventure is complete without a selection of cutting-edge spy gadgets. Similarly, your marketing efforts can benefit from showcasing the tools and resources you use. The Spy Gadgets and Tools infographic should include:
- Gadget Icons: Represent your marketing tools and resources as high-tech gadgets. For example, your email marketing platform could be a sleek communicator device.
- Descriptions: Provide brief descriptions of each tool or resource and how they benefit your marketing strategy. Use concise, easy-to-understand language.
- Use Cases: Illustrate how these tools are used in different marketing scenarios. Show how they contribute to your overall success.
By presenting your marketing tools as sophisticated gadgets, you not only inform your audience about your capabilities but also create intrigue and curiosity.
Conclusion
In the world of marketing, it’s essential to capture your audience’s attention and convey your message effectively. Just like James Bond relies on a variety of tools and strategies to accomplish his missions, you can use infographics to enhance your marketing campaigns. Whether you choose the Spy Mission Infographic, the Casino Royale Stats Infographic, the Secret Agent Roadmap, or any of the other styles mentioned here, infographics can help you engage your audience and make a lasting impression.
Remember, the key to successful marketing, 007 style, is to combine compelling visuals with informative content. So, go ahead and create your own marketing infographics that leave a lasting impression, just like Bond himself.

Author:
Mark Ford

10 New Year’s Marketing Resolutions to Grow a Small Business Sustainably
Are you struggling to make your marketing efforts deliver steady growth instead of short bursts of activity? Wondering how to build a marketing approach that supports your small business over the long term without constant trial and error? […]
10 Marketing Trends for 2026: What Smart Businesses Will Focus On Next
Are you looking to understand how marketing is shifting in 2026 and what today’s smartest brands are prioritising? Want to know which strategic trends will shape how businesses attract, convert, and retain customers over the next year? […]
How to Build a Marketing Technology Stack That Actually Works Together
Are you trying to figure out how to connect your marketing tools so they actually support each other instead of working in isolation? Want to understand the key steps to building a marketing technology stack that runs smoothly across your entire customer journey? […]