
How successful is your Facebook page? Are you monitoring key metrics to see if there are areas in which you can improve?
Facebook provides all page owners with a free analytics platform where you can track important metrics like fan engagement, growth and post reach. Are you using that data to see how effective your page is? If not, login today!
While you’re there check on the 10 metrics in this infographic from Razor Social too.
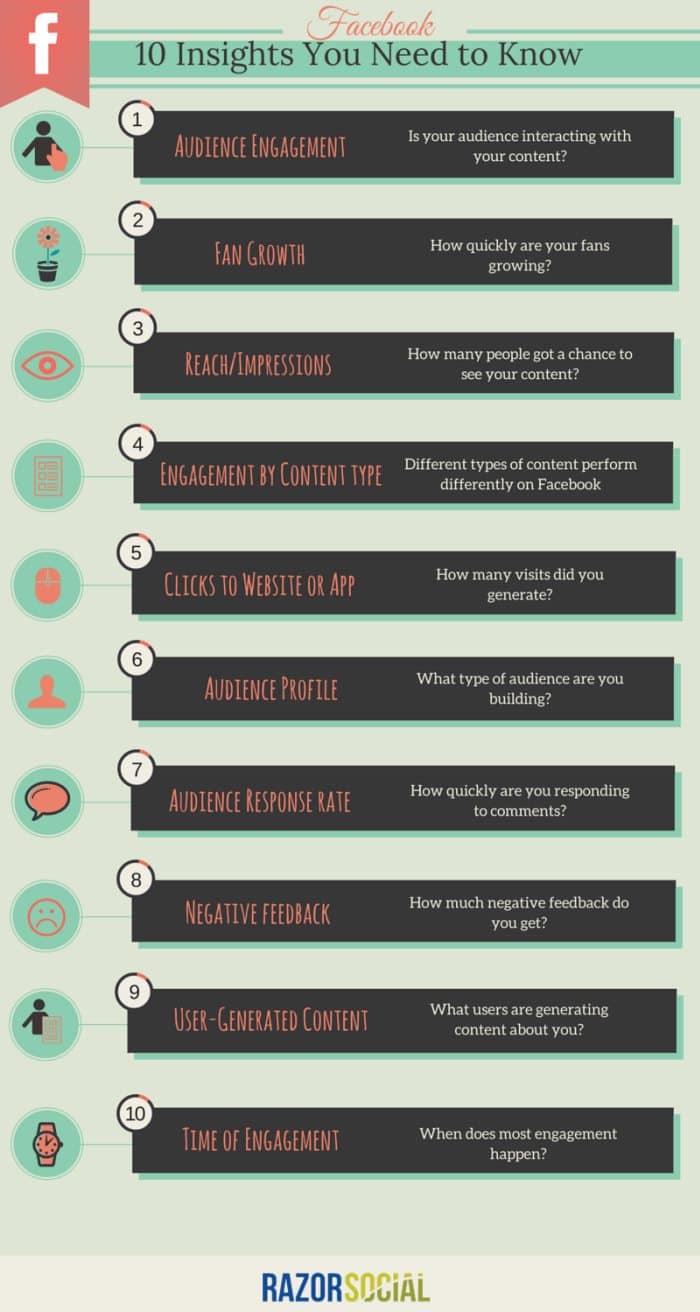
In the ever-evolving world of social media marketing, Facebook remains a dominant player. With over 2.8 billion monthly active users as of 2021, Facebook continues to be a platform that businesses can’t afford to ignore. Whether you’re a small business owner, a social media manager, or a marketer, understanding the performance of your Facebook Page is crucial for success. That’s where Facebook Analytics comes into play.
Facebook Analytics is a powerful tool that provides valuable insights into your Page’s performance and audience engagement. By tracking the right metrics, you can make informed decisions, refine your content strategy, and ultimately boost your brand’s presence on the platform. In this blog post, we’ll explore the ten key metrics that Facebook Page owners should be tracking.
1. Page Views
Page views are a fundamental metric to monitor. They indicate the total number of times your Facebook Page has been viewed during a specific period. Tracking this metric helps you understand the overall interest in your Page and its content. An increase in page views could signify growing brand awareness, while a decline may indicate the need for fresh, engaging content.
2. Likes and Follows
The number of Likes and Follows your Page receives is a direct indicator of your audience’s interest and loyalty. A steady increase in Likes and Follows can be a positive sign, showing that your content resonates with your target audience. Be sure to monitor these metrics regularly to assess the impact of your content and marketing efforts.
3. Reach
Reach measures the total number of unique users who have seen any content associated with your Facebook Page. It’s crucial to differentiate between organic reach (users who see your content without paid promotion) and paid reach (users reached through paid advertising). Analyzing reach helps you evaluate the effectiveness of your content distribution and advertising campaigns.
4. Engagement Rate
Engagement rate is a key metric that measures how actively your audience interacts with your content. It’s calculated by dividing the total engagement (likes, comments, shares) by the total reach and multiplying by 100 to get a percentage. A higher engagement rate indicates that your content is resonating with your audience and is more likely to be seen by others in their news feeds.
5. Click-Through Rate (CTR)
CTR is a crucial metric for evaluating the effectiveness of your Facebook posts and ads. It measures the percentage of people who clicked on a link or call-to-action button in your post or ad after seeing it. A high CTR indicates that your content is compelling and that your audience is taking the desired action.
6. Post Performance
Analyze the performance of individual posts to identify what resonates with your audience. Facebook provides insights into each post’s reach, engagement, and clicks. By understanding which types of posts perform best, you can refine your content strategy and create more of what your audience loves.
7. Audience Demographics
Understanding your audience demographics is crucial for tailoring your content to your target market. Facebook Analytics provides detailed demographic data, including age, gender, location, and more. This information helps you create content that speaks directly to your audience’s interests and needs.
8. Referral Traffic
If your Facebook Page is linked to a website or online store, tracking referral traffic is essential. It shows how many visitors came to your website from Facebook. This data helps you assess the effectiveness of your Facebook marketing in driving website traffic and conversions.
9. Video Metrics
Video content is becoming increasingly popular on Facebook. Tracking video metrics such as video views, watch time, and engagement (likes, comments, shares) is essential for video content creators. Use these insights to fine-tune your video strategy and create more engaging content.
10. Conversion Tracking
For businesses aiming to drive specific actions, such as product purchases or lead generation, conversion tracking is paramount. By setting up Facebook Pixel or other tracking mechanisms, you can measure the ROI of your Facebook advertising campaigns and optimize them for better results.
Now that we’ve covered the ten essential metrics to track on Facebook Analytics, let’s discuss how to access and interpret this valuable data.
How to Access Facebook Analytics
Accessing Facebook Analytics is straightforward. Follow these steps to get started:
- Go to Your Facebook Page: Log in to the Facebook account that has administrative access to the Page you want to analyze.
- Navigate to Facebook Business Suite: Click on “More” in the left-hand menu of your Page, then select “Business Suite.” If you haven’t set up Business Suite yet, follow the prompts to do so.
- Access Insights: Once in Business Suite, click on “Insights” in the left-hand menu. Here, you’ll find a wealth of data about your Page’s performance.
Interpreting Facebook Analytics Data
Now that you’re in Facebook Analytics, let’s discuss how to interpret the data you’ll find there.
- Time Period: You can select the time period you want to analyze, ranging from the last seven days to a specific date range. It’s essential to choose a relevant timeframe for your analysis.
- Comparative Data: Facebook Analytics allows you to compare your current performance to a previous period. This can help you identify trends and improvements.
- Customized Dashboards: You can create customized dashboards to track the specific metrics that matter most to your business goals. This makes it easy to focus on the data that’s most relevant to you.
- Export Data: If you need to share the data or perform further analysis outside of Facebook Analytics, you can export the data in various formats, such as Excel or CSV.
- Demographic Insights: Dive deep into the demographics of your audience. Understanding your audience’s age, gender, location, and interests can help you tailor your content strategy.
- Ad Performance: If you’re running Facebook ads, Facebook Analytics provides detailed insights into ad performance, including ad reach, engagement, and conversion data.
Tips for Effective Facebook Page Analysis
Analyzing your Facebook Page’s performance is more than just looking at numbers; it’s about deriving meaningful insights to inform your strategy. Here are some tips for effective Facebook Page analysis:
- Set Clear Goals: Before diving into the data, establish clear goals for your Facebook Page. What do you want to achieve? Whether it’s brand awareness, lead generation, or e-commerce sales, having defined objectives will help you focus your analysis.
- Track Trends: Look for patterns and trends in your data. Are there specific days or times when your audience is most active? Do certain types of content consistently perform well? Identifying trends can guide your content strategy.
- Experiment and Iterate: Don’t be afraid to experiment with different types of content, posting schedules, and ad campaigns. Facebook Analytics allows you to assess the impact of these experiments and make data-driven adjustments.
- A/B Testing: When running ad campaigns, consider A/B testing to determine which ad creatives, headlines, and targeting options yield the best results. Facebook’s split testing feature can help you optimize your ad performance.
- Monitor Competitors: Keep an eye on your competitors’ Facebook Pages. Facebook’s “Pages to Watch” feature allows you to track the performance of other Pages in your industry. Analyzing what works for them can provide valuable insights.
- Engage with Insights: Don’t just view your data passively; engage with it. Ask questions, draw conclusions, and use the insights to make informed decisions. Regularly revisit your analytics to stay up-to-date with your Page’s performance.
- Stay Informed: Facebook’s algorithms and features evolve over time. Stay informed about changes in the platform and how they may impact your Page’s performance. Attend webinars, read industry blogs, and follow Facebook’s official updates.
Conclusion
Facebook Analytics is a powerful tool that provides a wealth of data to help you understand and optimize your Facebook Page’s performance. By tracking metrics like page views, engagement rate, and conversion tracking, you can gain valuable insights into your audience, content, and advertising efforts.
Remember that effective analysis goes beyond just collecting data; it involves interpreting the data to make informed decisions. Set clear goals, track trends, experiment, and stay informed about the ever-changing landscape of Facebook marketing.
In the world of social media marketing, knowledge is power. By harnessing the insights provided by Facebook Analytics, you can refine your strategy, reach a larger audience, and ultimately achieve your business objectives on this influential platform. So, start tracking those metrics and watch your Facebook Page thrive.

Author:
Mark Ford