Are you using infographics as part of your SEO strategy? Want to learn how to create infographics that get shared thousands of times?
Infographics are one of the best ways to earn those all-important backlinks you need to improve your SEO, but you’ll only succeed with top quality graphics that people will genuinely want to share.
To help boost your contents visual appeal TwelveSkip have created this infographic.
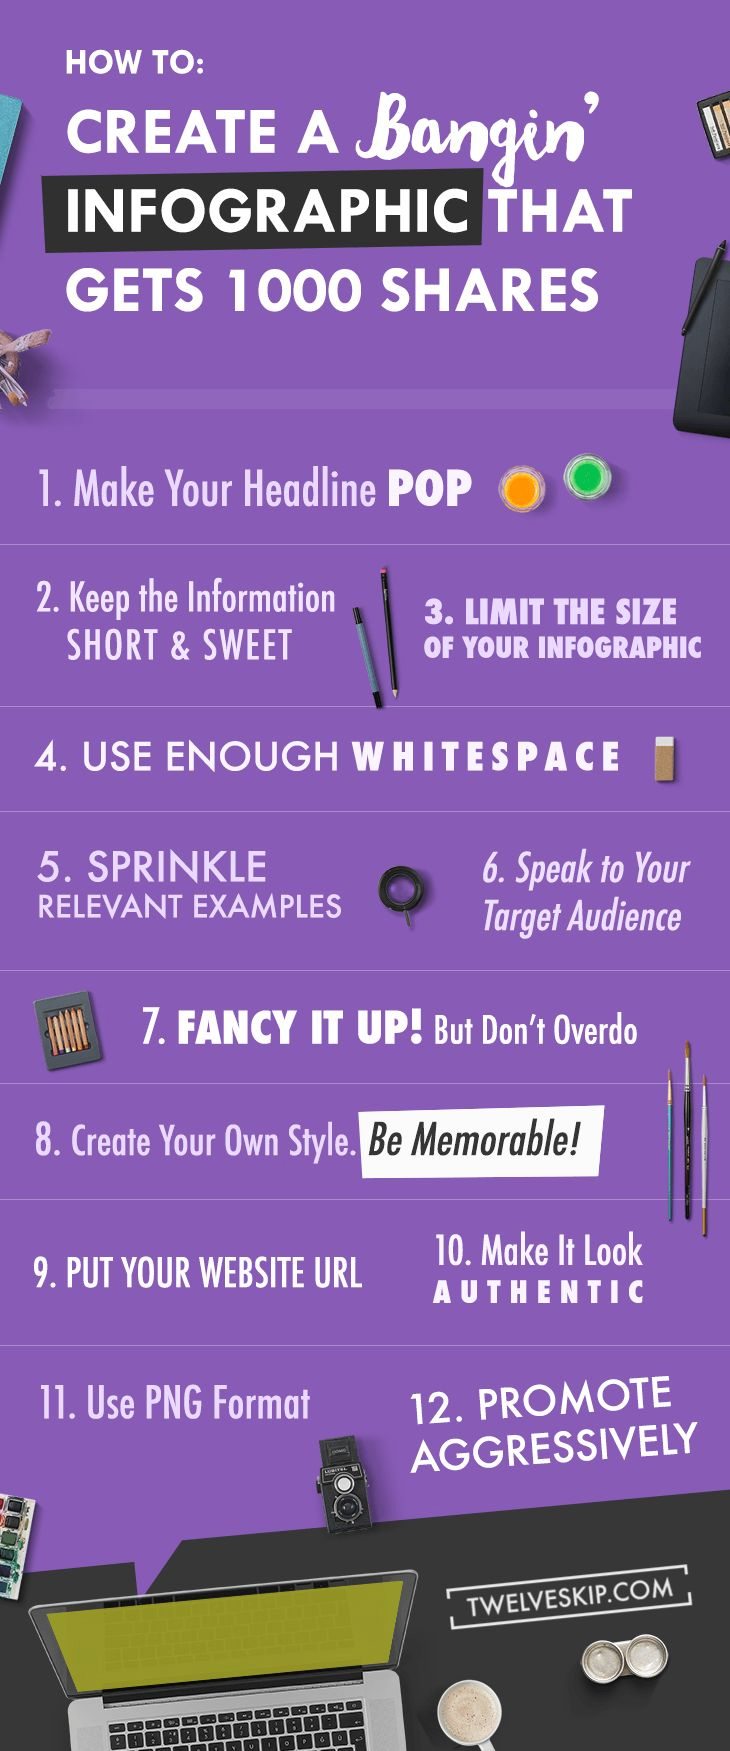
In today’s digital age, information is consumed at an astonishing rate. People scroll through social media feeds, websites, and blogs looking for content that catches their eye and delivers value quickly. This is where infographics come into play. Infographics are visually appealing, information-packed graphics that condense complex data into an easy-to-understand format. When done right, they can grab the attention of your audience, communicate your message effectively, and even go viral. In this blog post, we’ll explore the step-by-step process of creating an infographic that not only bangs but also gets thousands of shares.
Understanding the Power of Infographics
Before we dive into the nitty-gritty of creating an amazing infographic, let’s take a moment to understand why they are so powerful in the first place.
1. Visual Appeal
Humans are naturally drawn to visuals. In fact, our brains process visual information 60,000 times faster than text. Infographics leverage this innate preference for visuals to communicate information more effectively.
2. Simplified Information
Infographics distill complex information into bite-sized, easy-to-understand chunks. This makes them perfect for explaining intricate concepts, statistics, or processes.
3. Shareability
When people come across an engaging and informative infographic, they are more likely to share it with their network. This sharing can lead to a snowball effect, increasing the reach and impact of your content.
4. SEO Benefits
Infographics can also boost your website’s SEO. When people share your infographic and link back to your site, it improves your domain authority and search engine rankings.
Now that we understand the power of infographics, let’s jump into the steps for creating one that stands out and gets shared widely.
Step 1: Define Your Goal and Audience
The first step in creating a successful infographic is to clearly define your goal and understand your target audience. Ask yourself:
- What message or information do I want to convey with this infographic?
- Who is my target audience, and what are their interests and pain points?
- What action do I want my audience to take after viewing the infographic?
Having a clear goal and audience in mind will guide the entire creation process and ensure your infographic is relevant and engaging.
Step 2: Research and Collect Data
Once you have a clear goal and audience, it’s time to gather the data you’ll need for your infographic. Depending on your topic, this may involve:
- Conducting surveys or polls.
- Analyzing existing data and statistics.
- Researching industry reports and studies.
- Gathering quotes, testimonials, or expert opinions.
Ensure that the data you collect is accurate, up-to-date, and relevant to your audience’s interests.
Step 3: Choose the Right Type of Infographic
Infographics come in various formats, each suited to different types of information and goals. Common types of infographics include:
- Statistical Infographics: Present data and statistics in a visually appealing way.
- Process Infographics: Explain a series of steps or a workflow.
- Timeline Infographics: Show the chronological sequence of events.
- Comparison Infographics: Highlight the differences between two or more items.
- List Infographics: Present information as a list with visuals.
Choose the type of infographic that best suits your content and message. For example, if you’re presenting survey results, a statistical infographic might be the best choice.
Step 4: Create a Storyboard or Outline
Before diving into the design phase, it’s a good idea to create a storyboard or outline of your infographic. This will help you structure your information logically and ensure a smooth flow from start to finish. Consider the following elements:
- Introduction: A catchy title and a brief introduction to your topic.
- Main Sections: Divide your content into easily digestible sections.
- Visual Elements: Decide where images, icons, and charts will go.
- Data Presentation: Plan how you’ll present your data effectively.
- Conclusion: Summarize the key takeaways and call to action.
Step 5: Design Your Infographic
Now comes the fun part—designing your infographic. You don’t need to be a graphic designer to create an eye-catching infographic, but you should follow some design principles:
- Choose a Color Scheme: Stick to a consistent color palette that matches your brand or theme.
- Use Visual Hierarchy: Emphasize key points using font size, color, and placement.
- Keep It Simple: Avoid clutter and unnecessary details.
- Include Visuals: Use images, icons, and charts to enhance understanding.
- Use White Space: Give elements room to breathe for a clean look.
- Ensure Readability: Use legible fonts and appropriate font sizes.
There are various tools available for creating infographics, such as Canva, Adobe Illustrator, or even PowerPoint. Experiment with layouts, colors, and fonts until you find a design that resonates with your audience and aligns with your brand.
Step 6: Craft a Compelling Title and Headlines
Your infographic’s title and headlines play a crucial role in capturing your audience’s attention. Make them intriguing, concise, and relevant to the content. A great title can make the difference between your infographic being shared or ignored.
Step 7: Add Data and Visuals
Now, it’s time to populate your infographic with the data you’ve collected. Be sure to:
- Present data accurately.
- Use clear and easy-to-understand charts or graphs.
- Include labels and captions to provide context.
- Use visuals strategically to enhance comprehension.
Your goal is to make complex information digestible at a glance.
Step 8: Tell a Story
Remember that your infographic should tell a story. Don’t just throw data and visuals together randomly. Instead, guide your audience through a narrative that flows logically. Use arrows, numbers, or connectors to lead the viewer from one point to the next.
Step 9: Review and Edit
Once your infographic is designed and populated with content, take the time to review and edit it. Check for:
- Spelling and grammatical errors.
- Consistency in design elements.
- Accuracy of data and citations.
- Clarity and coherence of the narrative.
Step 10: Add Sharing Options
To encourage sharing, make it easy for viewers to share your infographic. Include social media sharing buttons directly on the infographic or provide clear instructions on how to share it. Additionally, you can offer an embed code for websites and blogs, allowing others to easily share your infographic on their platforms.
Step 11: Promote Your Infographic
Creating an amazing infographic is only half the battle. To get thousands of shares, you need to promote it effectively. Here are some promotion strategies:
- Share on Social Media: Post your infographic on your social media profiles and relevant groups or communities.
- Email Outreach: Send your infographic to your email subscribers and ask them to share it.
- Blogger Outreach: Reach out to bloggers and influencers in your niche and ask if they’d like to feature your infographic in their content.
- Submit to Infographic Directories: There are directories dedicated to infographics where you can submit your work.
- Guest Posts: Offer to create a guest post for other websites and include your infographic as part of the content.
- Paid Promotion: Consider running paid social media ads to boost your infographic’s reach.
Step 12: Analyze and Learn
Once your infographic has been shared and viewed, analyze its performance. Use tools like Google Analytics to track the traffic it generates to your website. Pay attention to social media engagement metrics like likes, shares, and comments. Use this data to learn what worked and what didn’t, and apply these insights to your future infographic projects.
Conclusion
Creating a banging infographic that gets thousands of shares is a rewarding endeavor that combines creativity, data, and promotion. By following the steps outlined in this guide, you can craft infographics that not only capture your audience’s attention but also inspire them to share your valuable content with others. Remember, the key to success is a clear goal, thorough research, compelling design, and strategic promotion. With dedication and practice, you can become a master of infographics and harness their power to communicate your message effectively in the digital age.

Author:
Mark Ford