Are you still ignoring the calls to add visual content to your marketing strategy? Need some convincing about the power visuals hold over your target customers?
In today’s fast-paced digital world, capturing the attention of your target audience has become more challenging than ever before. With information overload on the internet, people tend to scroll through content at lightning speed, making it crucial for businesses and content creators to find ways to stand out. Visual content has emerged as a powerful tool in this endeavor, and the statistics are clear: it’s on the rise and here to stay.
In this blog post, we’ll explore the undeniable rise of visual content and back it up with compelling statistics. We’ll delve into why visual content is so effective, its various forms, and how you can harness its power to engage and convert your audience.
Infographic Design Team share the stats you need to know in this infographic.
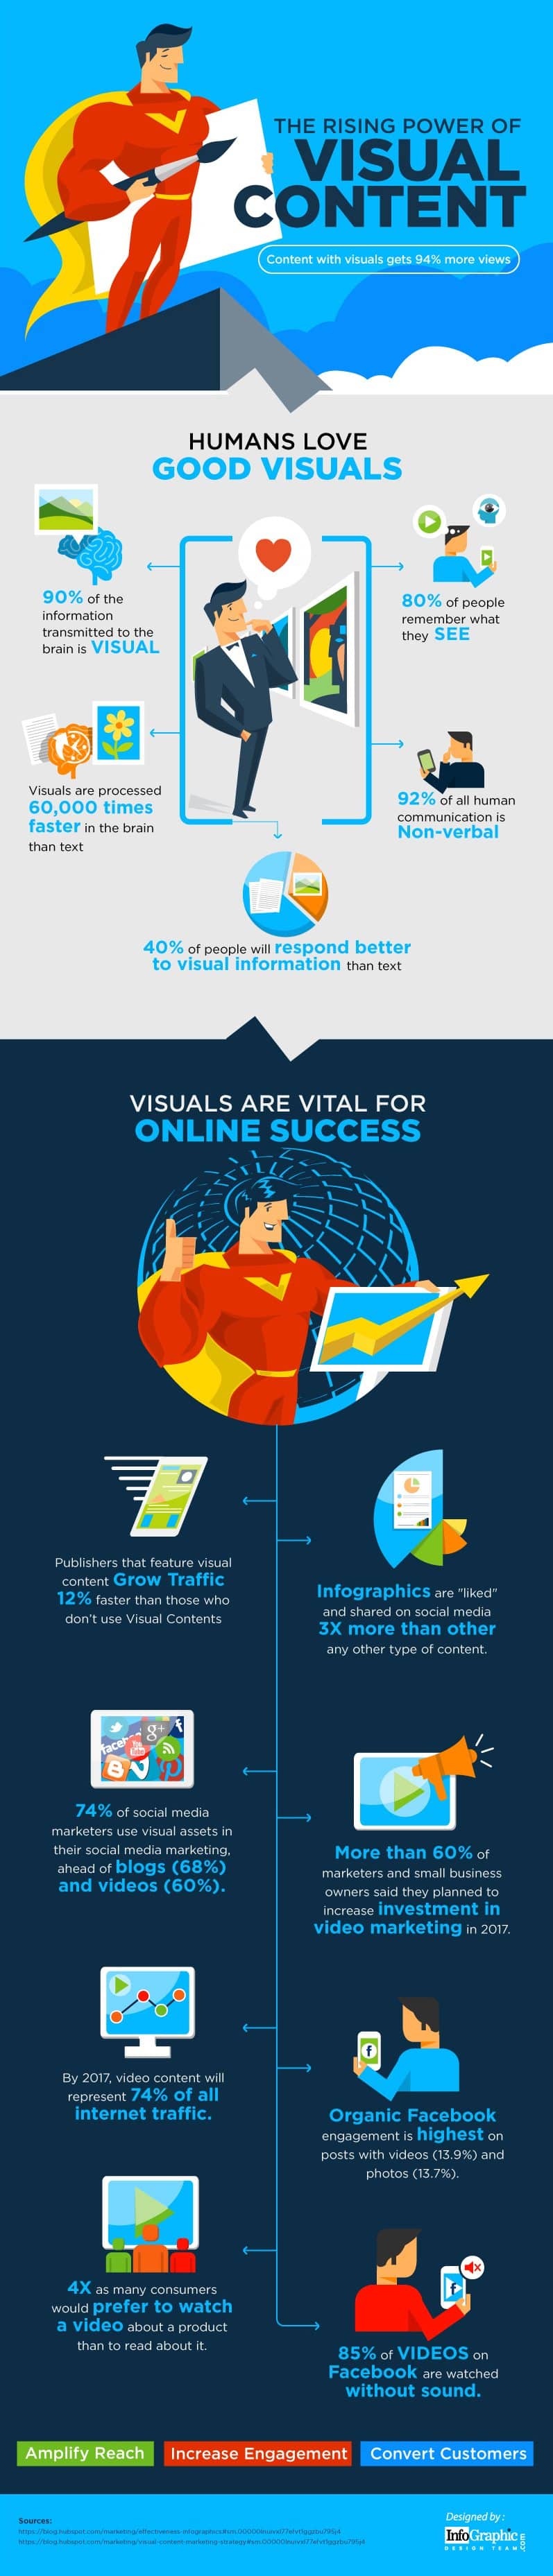
The Visual Revolution: A Snapshot
The human brain is wired to process visual information much faster and retain it longer compared to text-based content. This fact alone highlights the potential of visual content in today’s digital landscape. Let’s start by examining some key statistics that underscore the rise of visual content:
1. Visual Content Dominates Social Media
Social media platforms have evolved into visual-first channels. Here are some statistics that highlight this trend:
- Images on Twitter: Tweets with images receive 150% more retweets than those without images.
- Video on Facebook: Video posts on Facebook receive 135% more organic reach than photo posts.
- Instagram’s Growth: Instagram, a platform primarily focused on visual content, reached over 1 billion monthly active users within 8 years of its launch.
- Pinterest’s Influence: 83% of Pinterest users have made a purchase based on the content they’ve seen from brands on the platform.
- Snapchat’s Appeal: Over 5 billion videos are viewed on Snapchat every day.
2. The Power of Video
Video content is the undisputed king of visual media. Here’s why:
- YouTube’s Immense Reach: YouTube is the second-largest search engine, with more than 2 billion logged-in monthly users.
- Video on Websites: Adding a video to your website’s landing page can increase conversion rates by 80%.
- Mobile Video: 92% of mobile video viewers share videos with others.
- Live Streaming: Live video is favored by social media algorithms, resulting in 10 times more engagement than regular videos.
3. Infographics: Visualizing Data
Infographics are a brilliant way to convey complex information in an engaging manner:
- Infographics in Content Marketing: Content with infographics gets 94% more views than content without.
- Visual Storytelling: 65% of people are visual learners, making infographics an effective tool for education and communication.
4. Visual Search
Visual search is a rising trend, driven by advancements in AI and machine learning:
- Google Lens: Google’s visual search tool, Google Lens, receives over 500 million monthly searches.
- Pinterest Lens: Pinterest’s visual search tool, Lens, can recognize over 2.5 billion objects and has seen a 140% increase in visual searches.
5. User-Generated Content
User-generated content (UGC) is a powerful form of visual content:
- UGC Impact: 85% of consumers find UGC more influential than brand-generated photos or videos.
- Trustworthiness: People trust UGC 9.8 times more than traditional influencer content.
Why Visual Content Works
Now that we’ve established the undeniable rise of visual content, it’s essential to understand why it’s so effective. Several key psychological and practical factors contribute to the effectiveness of visual content:
1. Attention Span
In an age where attention spans are shrinking, visual content quickly grabs and holds the viewer’s attention. It’s estimated that the average attention span is around 8 seconds, and visual content can deliver a message more efficiently within this short window.
2. Emotion and Memory
Visuals are more likely to evoke emotions and trigger memory recall. People remember 65% of the information paired with relevant visuals compared to just 10% of information from text alone.
3. Shareability
Visual content is inherently shareable. The ease of sharing images, videos, and infographics on social media platforms makes them ideal for virality, expanding your reach far beyond your immediate audience.
4. Universal Appeal
Visuals transcend language barriers. They can communicate ideas, emotions, and concepts to a global audience without the need for translation.
Harnessing the Power of Visual Content
Now that you’re convinced of the power of visual content, let’s explore how you can harness it effectively in your marketing and content strategies:
1. Know Your Audience
Understanding your target audience is the foundation of successful visual content. Different demographics and segments respond to various types of visuals. Conduct thorough audience research to tailor your visual content to their preferences and needs.
2. High-Quality Visuals
Invest in high-quality visuals. Whether it’s images, videos, infographics, or user-generated content, ensure they are well-crafted, clear, and visually appealing. Poor-quality visuals can detract from your message and brand image.
3. Consistency is Key
Maintain consistency in your visual content. Develop a style guide that includes color schemes, fonts, and visual elements that align with your brand identity. This consistency will help build brand recognition and trust.
4. Storytelling
Visual content is a powerful storytelling tool. Use it to narrate your brand’s story, convey your values, and engage your audience emotionally. Story-driven content resonates deeply with viewers.
5. Interactive Content
Consider incorporating interactive visual content, such as polls, quizzes, and interactive infographics. These elements encourage engagement and active participation from your audience.
6. SEO Optimization
Optimize your visual content for search engines. Use descriptive file names, alt text, and captions that include relevant keywords to improve visibility and search engine rankings.
7. Test and Analyze
Regularly analyze the performance of your visual content. Monitor metrics like engagement, shares, and conversions. Use A/B testing to refine your visuals and strategies for better results.
Conclusion
In a digital world overflowing with information, visual content has emerged as a beacon of engagement and effectiveness. The statistics don’t lie: social media platforms are dominated by visuals, video content is booming, and infographics are reshaping how we consume data.
Understanding the psychology behind why visual content works and implementing best practices in your marketing strategy can set you apart from the competition. To thrive in the digital age, don’t get left behind—embrace the rising power of visual content and watch your audience grow, engage, and convert like never before.

Author:
Mark Ford